See What Changed Between Two Spreadsheets
TL;DR: Table Compare is a free online tool that shows the differences between two CSV, TSV, or Excel files as a real table diff — changed cells, added and deleted rows, column changes — right in your browser, no signup, nothing uploaded or transferred.Great for checking a re-exported price list, two versions of a data dump, or what changed in a shared workbook.
Start Comparing Tables…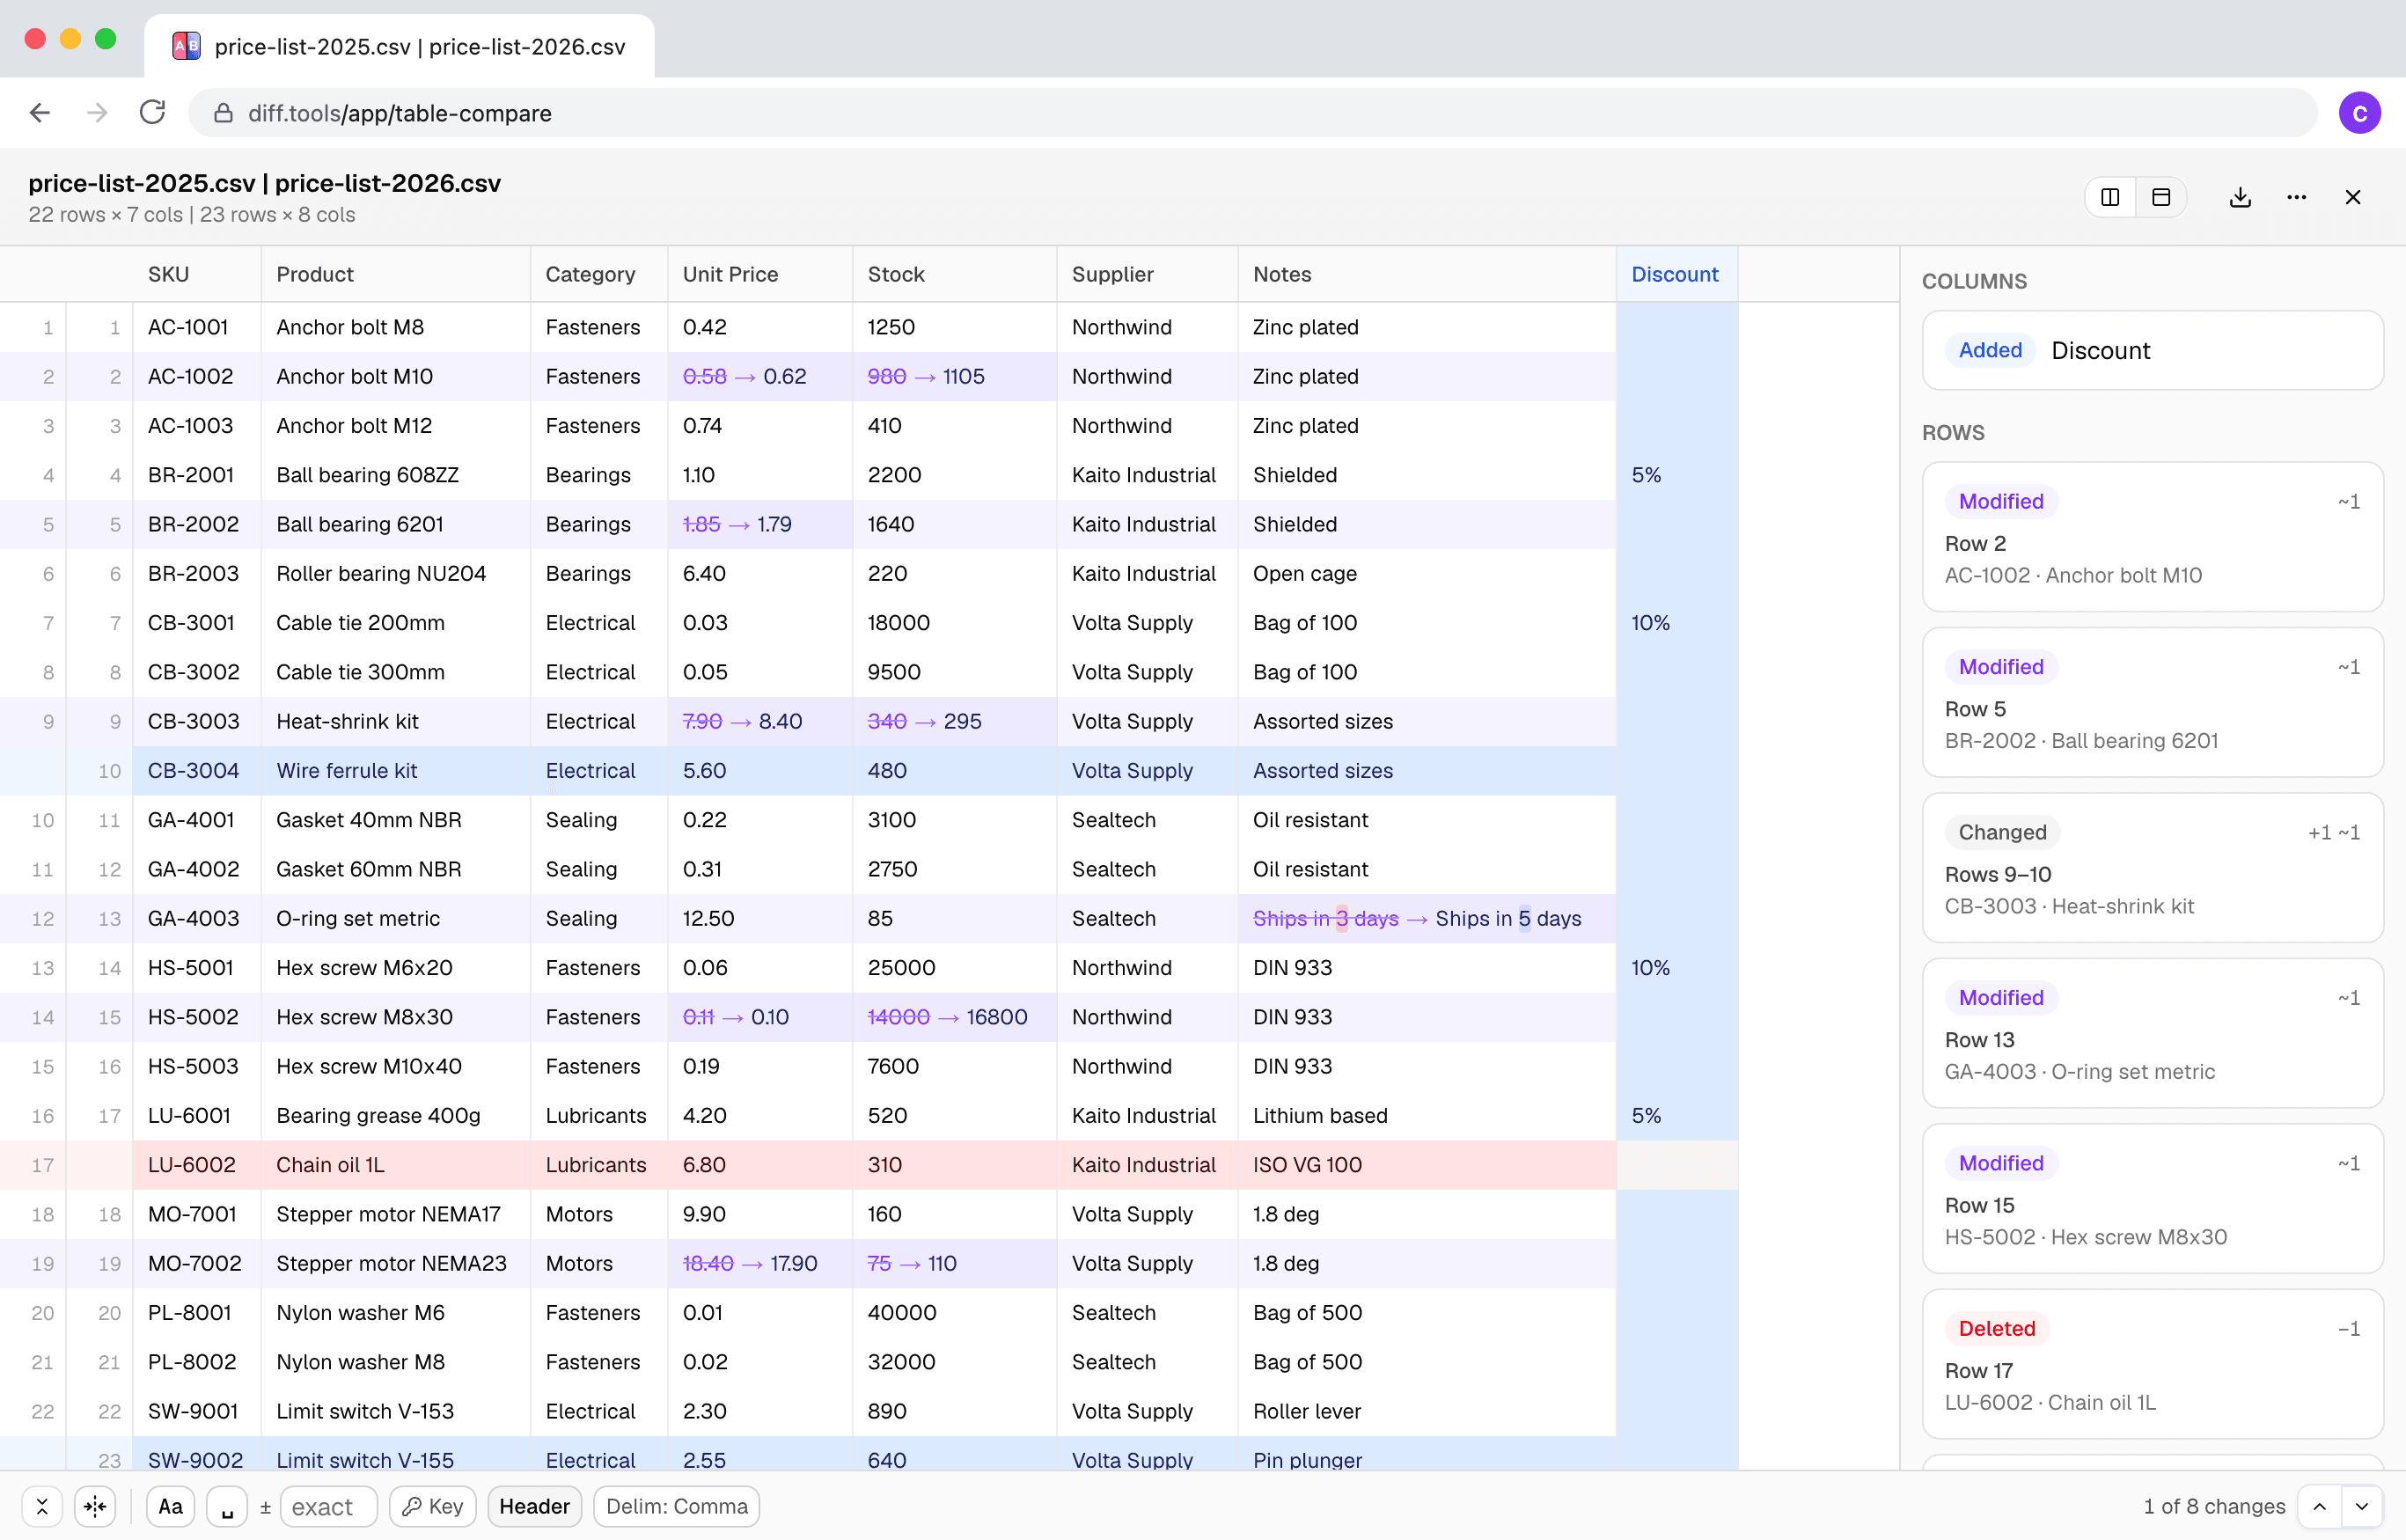

Built by Christopher Atlan at Leitmotif GmbH. Making file-comparison tools since 2020 — building software for over 18 years. diff.tools is one idea: a focused tool for each format, with results you can hand from one tool to the next.
A quick tour
Cells, not lines
Drop two files and read the result as a table, not a wall of text: each changed cell shows its old and new value in place, edits inside a text cell are marked word by word, and unchanged rows collapse so the changes stand out. Added, removed, and renamed columns are single cards in the sidebar — a shifted column never smears the whole file into false changes.
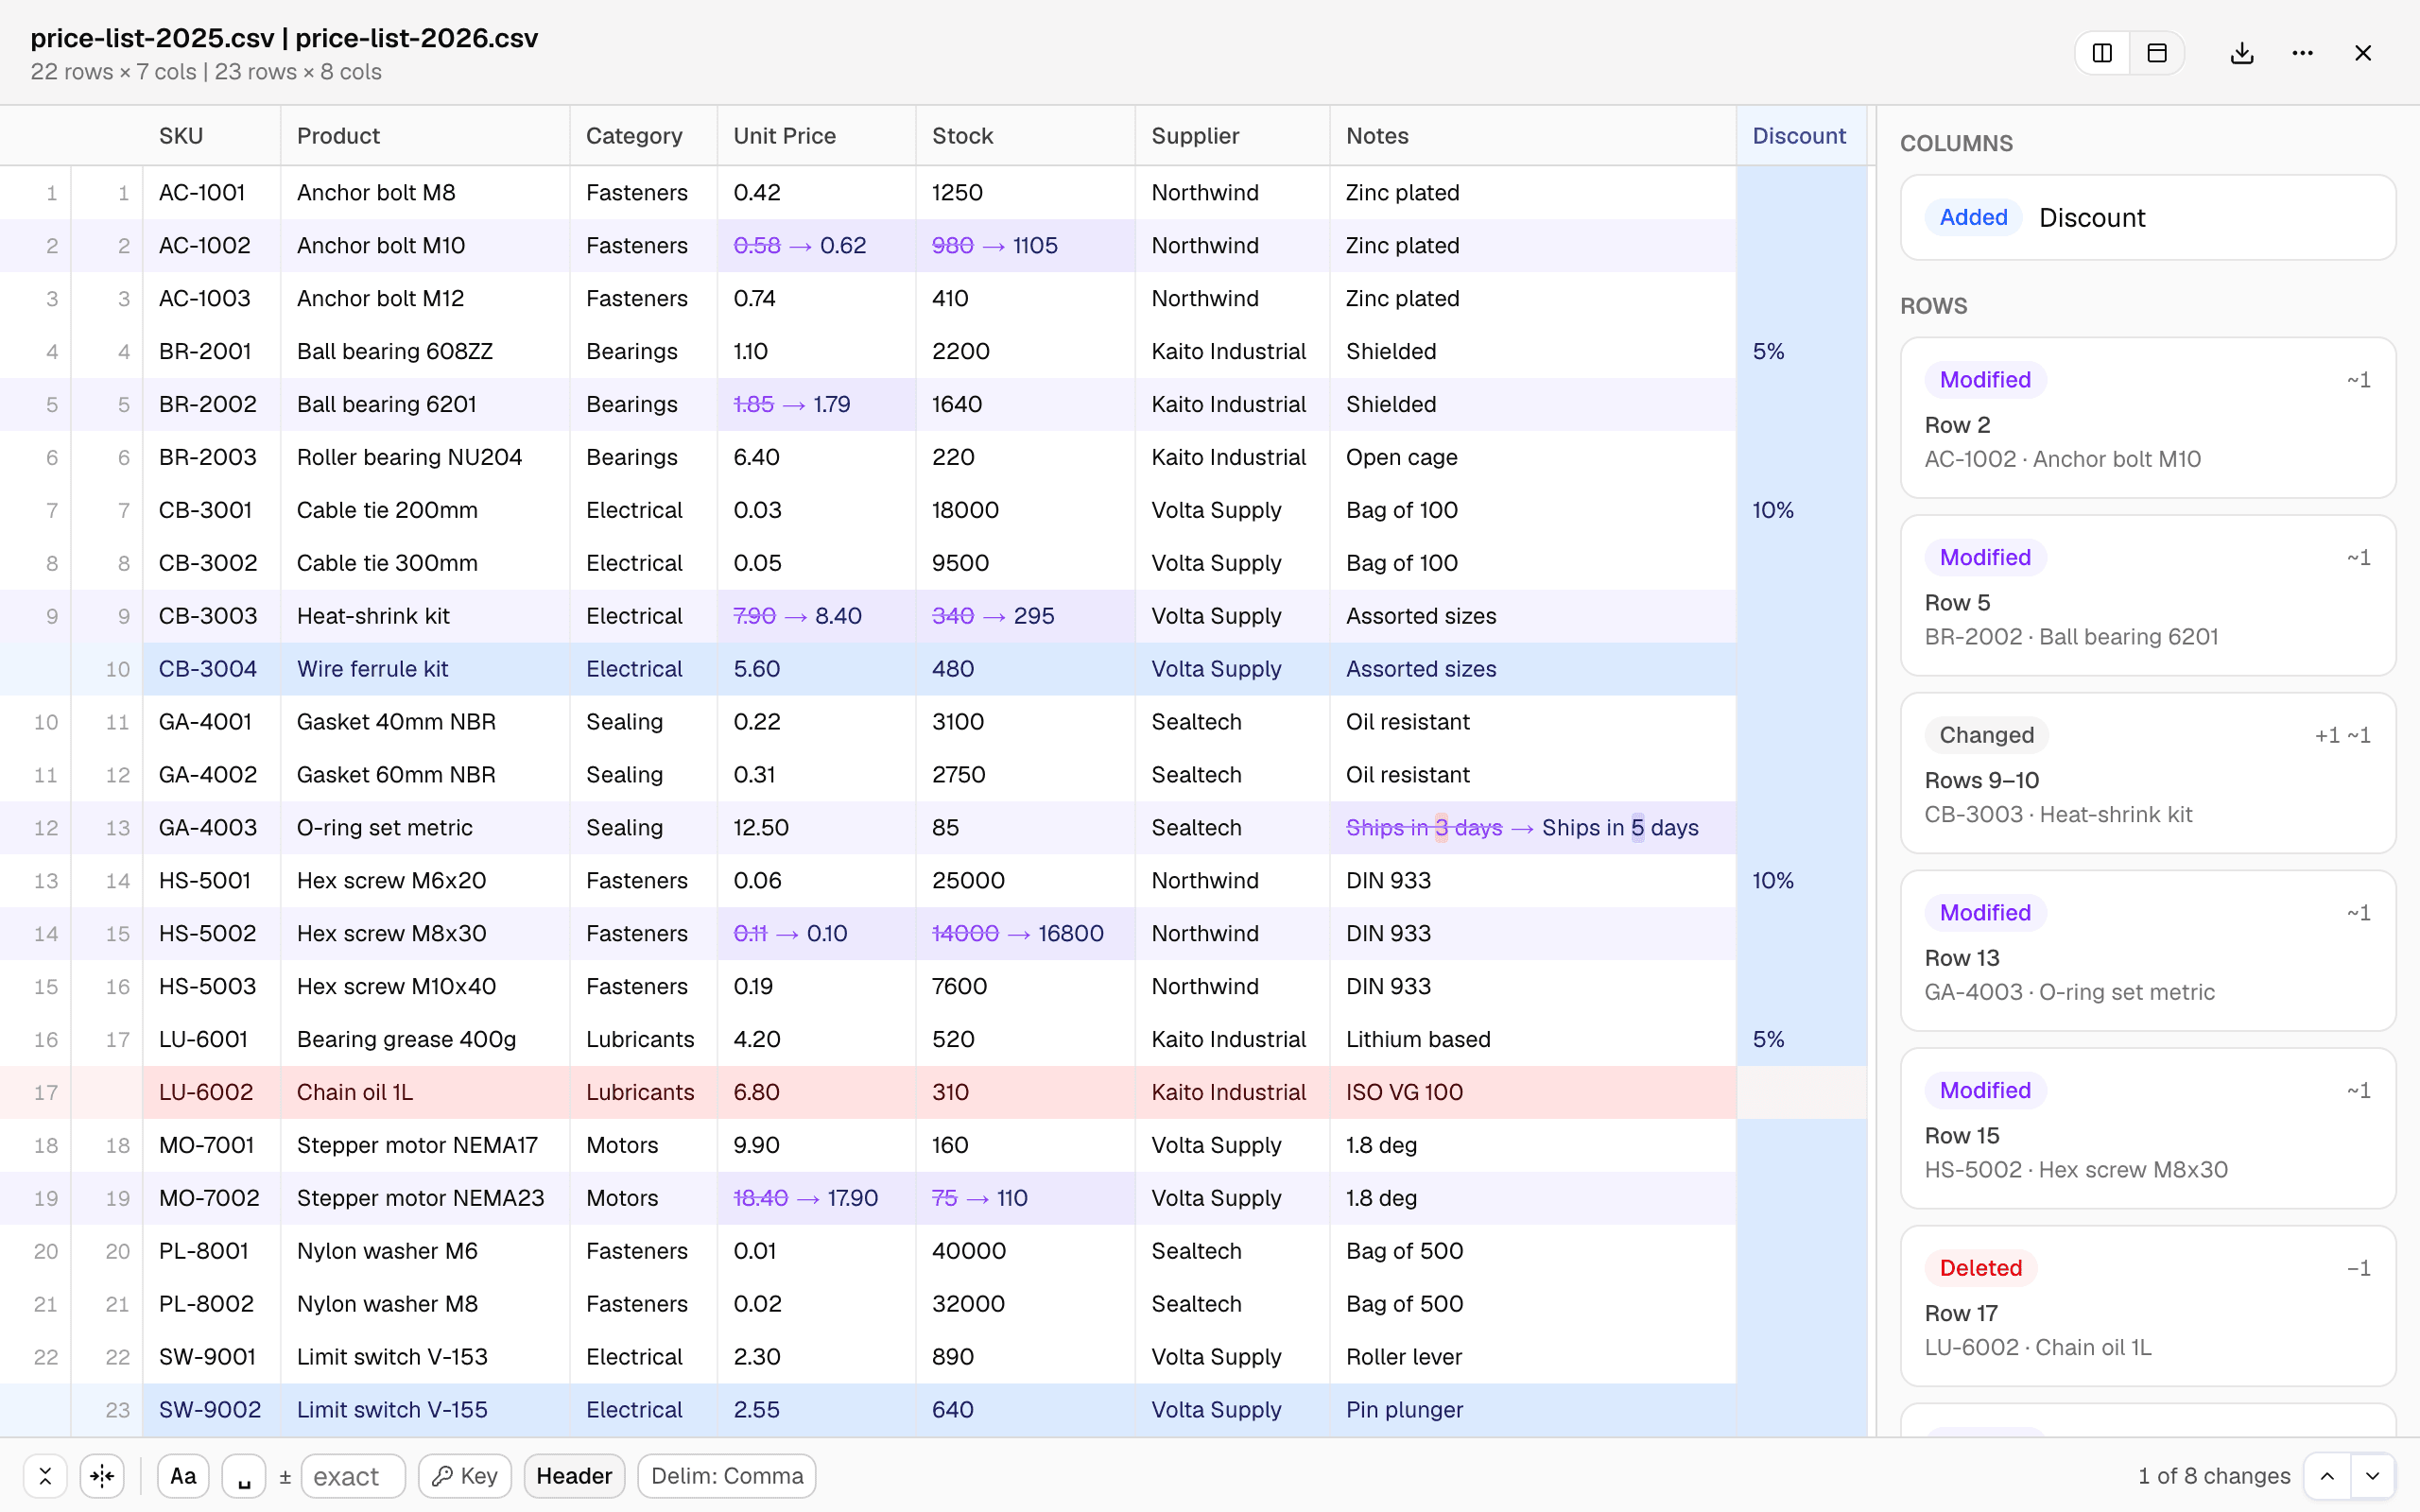
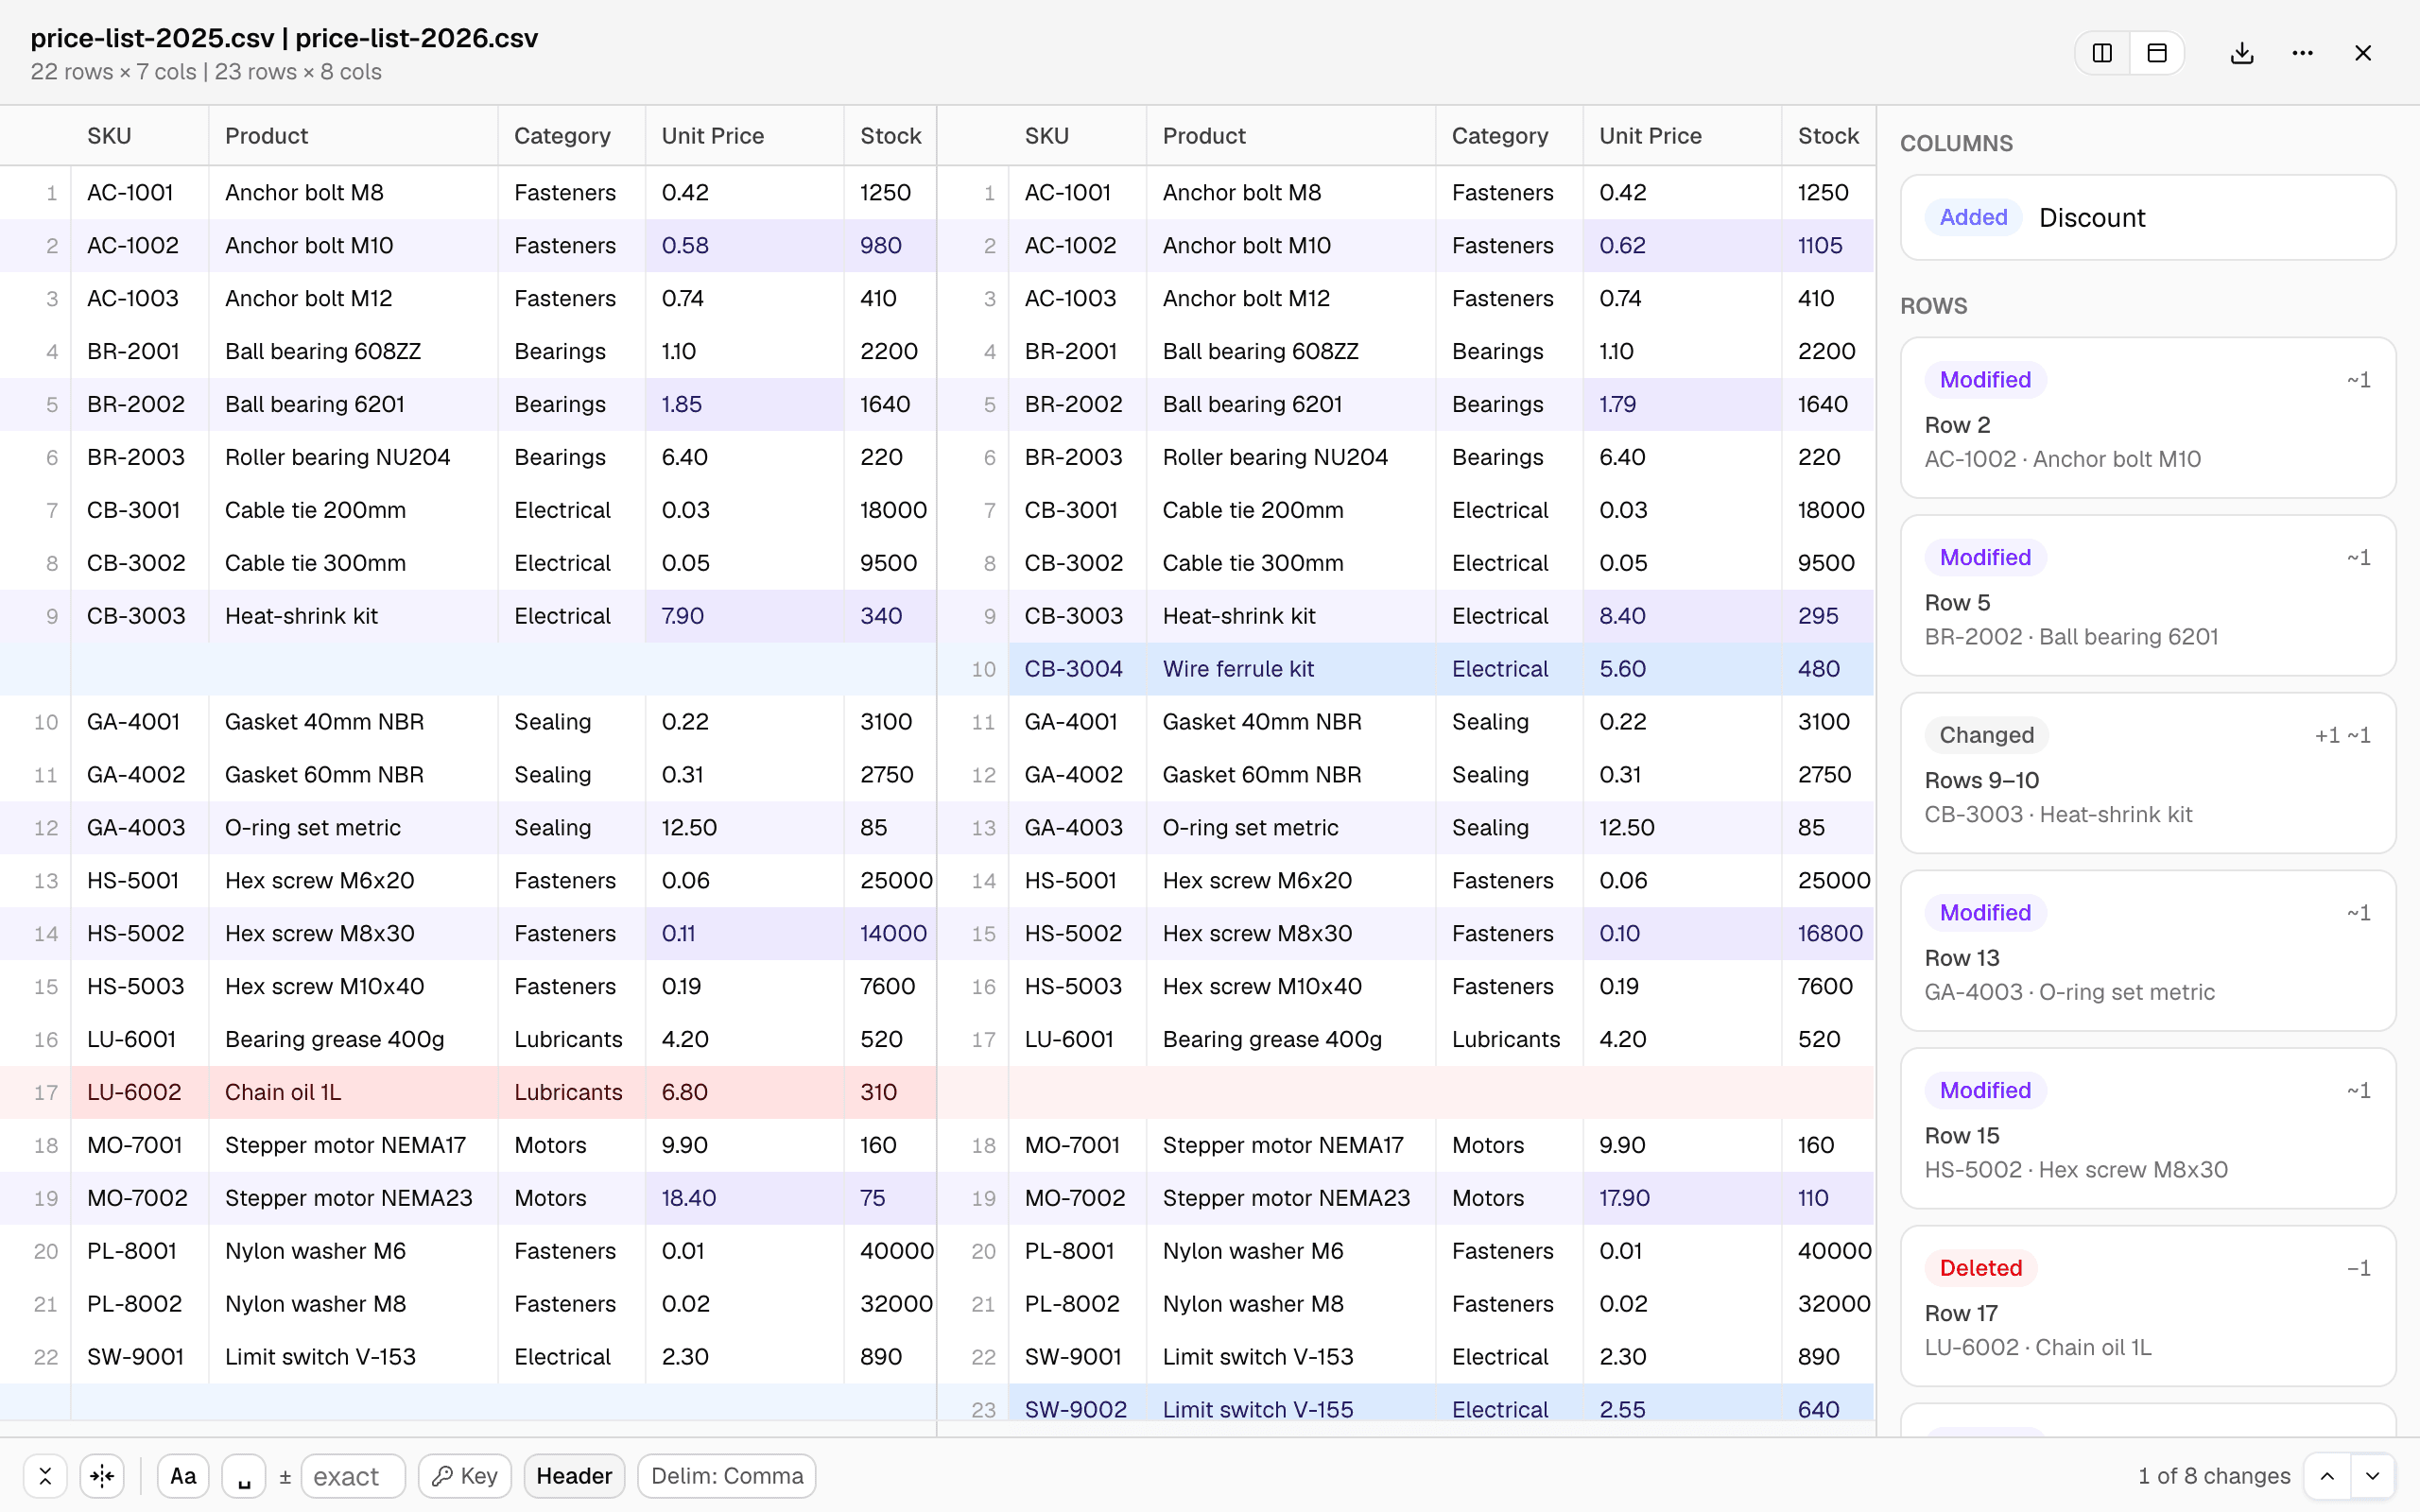
Two revisions of a price list — every change in its cell. Match rows your way
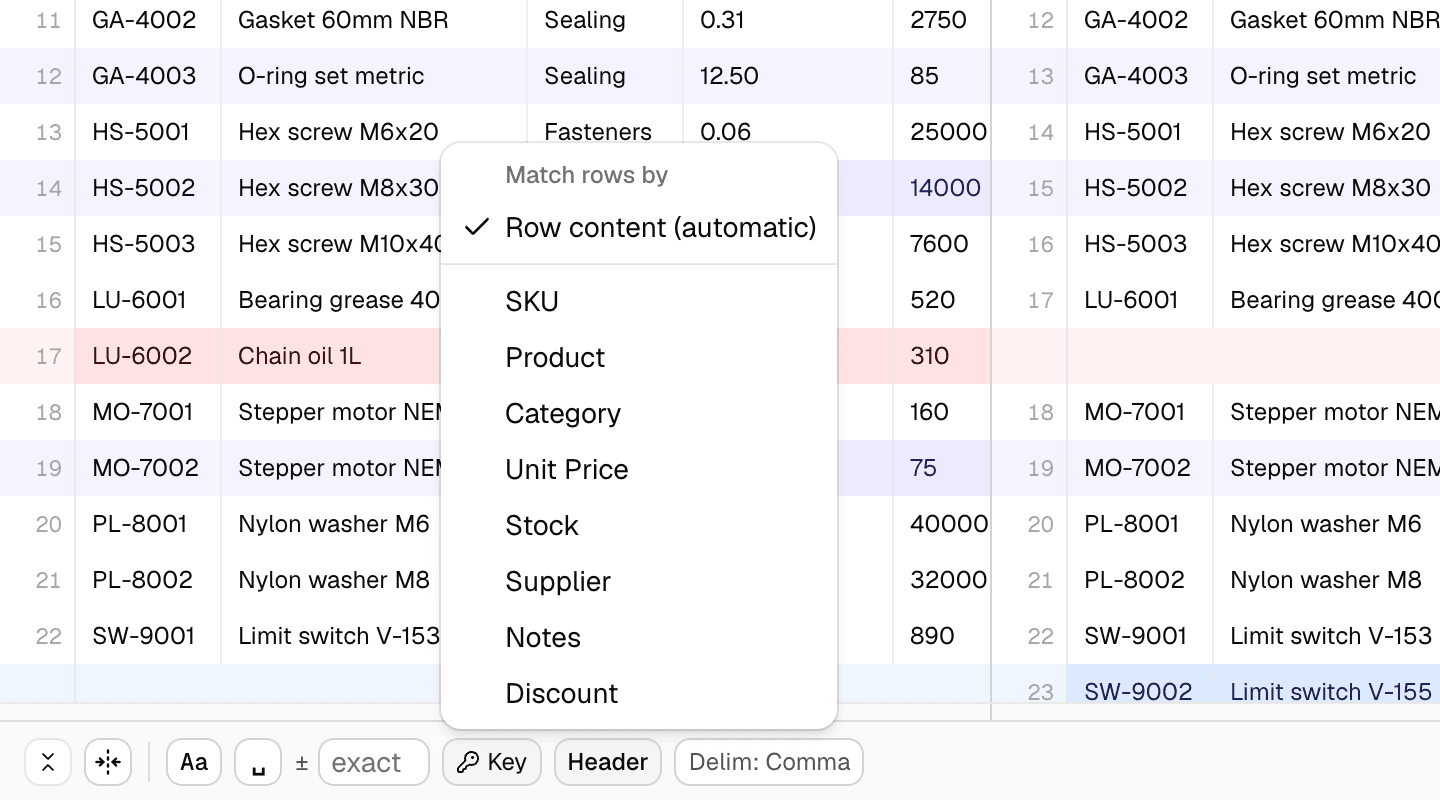
Rows pair by content automatically — reordered exports are detected and compared without a wall of move noise — or pick a key column for precise, fast pairing on big files. A numeric tolerance treats 24.00 and 24.001 as equal when you want it to, and case and whitespace toggles clean up the rest.
Whole workbooks, sheet by sheet
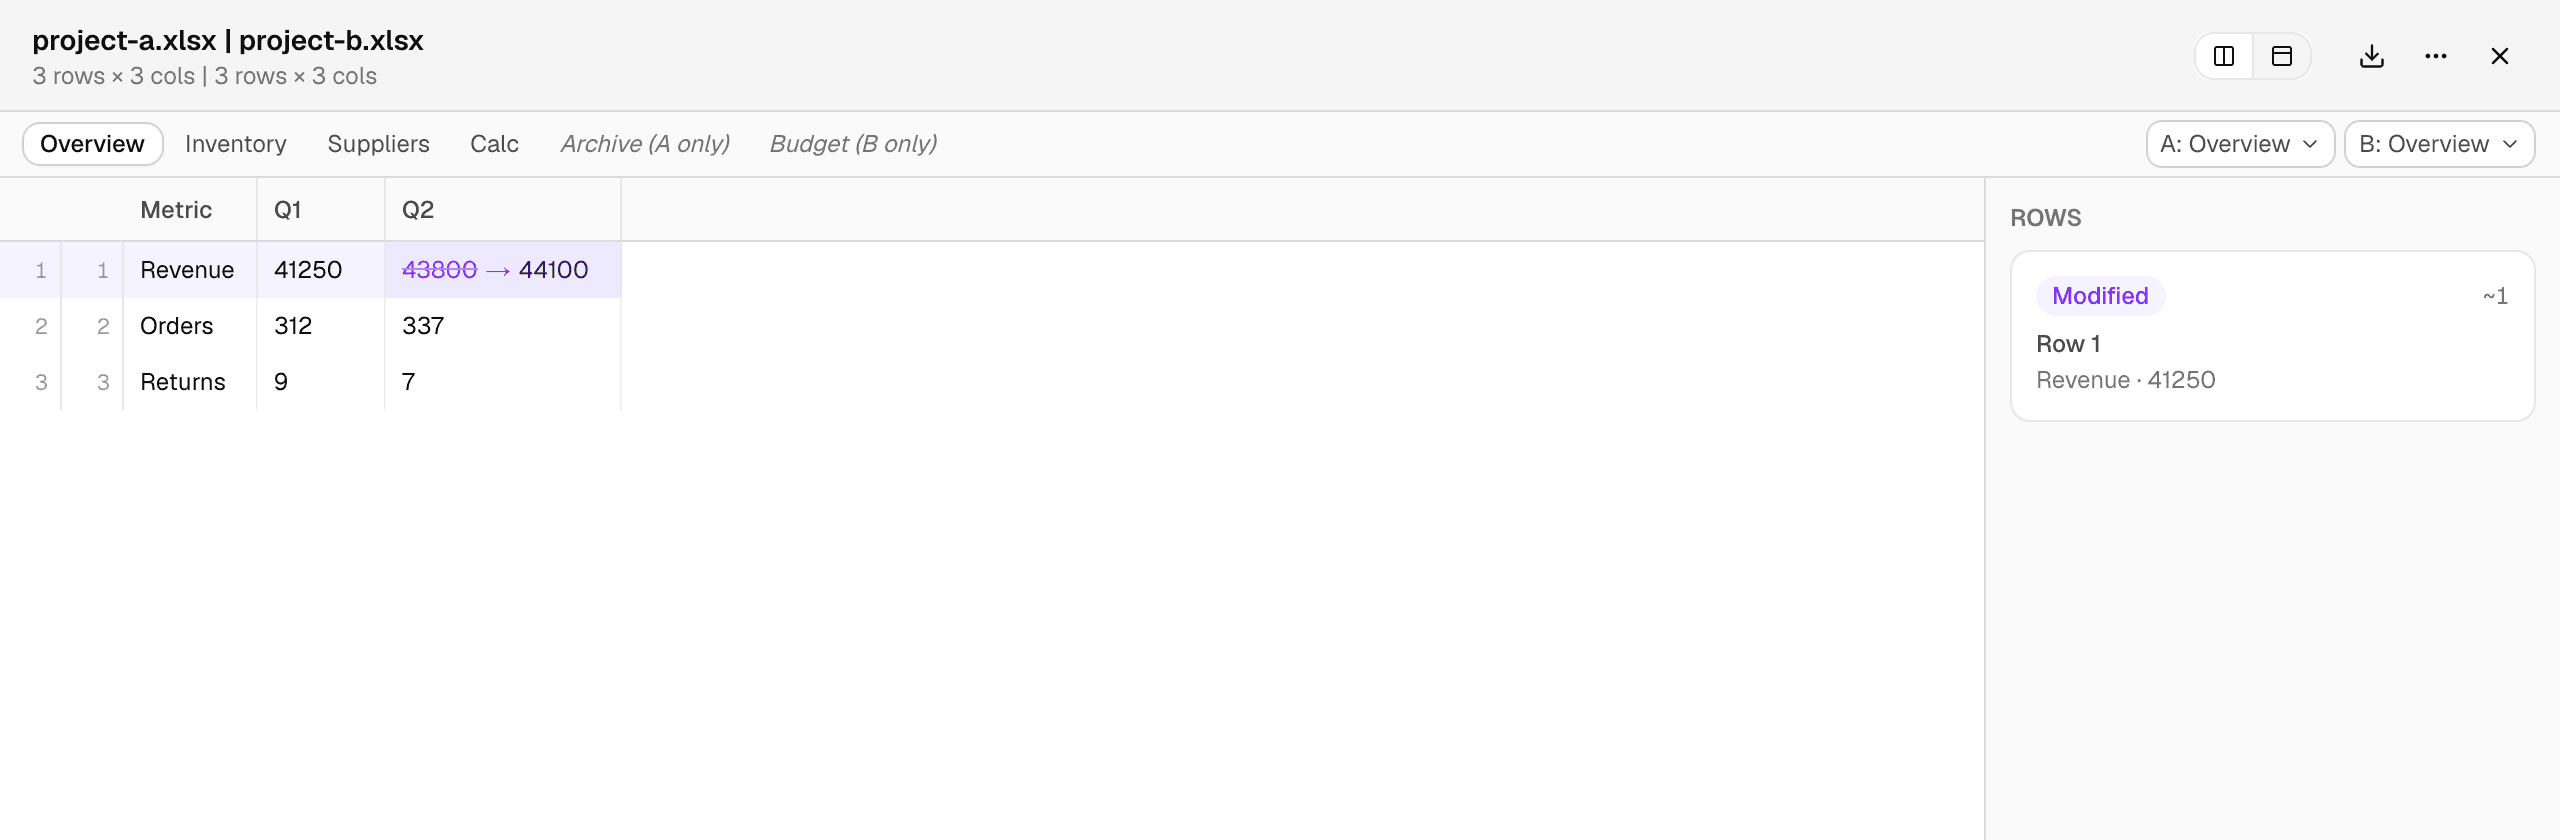
Excel files open as workbooks, not just first sheets: tabs pair by name even when the sheet order differs, sheets that exist on only one side are called out, and formulas can be compared instead of values when that's the real question.
Or read it side by side
The same comparison in two panes — version A left, version B right — with rows kept aligned by filler rows and both panes scrolling in lockstep, horizontally too. Prev/next navigation and the sidebar's region cards jump straight to any change.
Built for big files, exported for sharing
Parsing and diffing run in a worker, so exports with hundreds of thousands of rows compare in about a second and the grid stays smooth. When you're done, export the diff itself — as CSV, Excel, or a standalone HTML report anyone can open.